
Market Outlook
Quarterly Market Outlook
DECEMBER 2023

By Andrew Hung, CFA
Quantitative Analyst
" households contending with higher mortgage rates have led to a reduction of discretionary spending in the economy"
"...has the market gone too far? At the most optimistic point, markets had priced in up to 6 rate cuts in the next year, which is double what even the most optimistic Fed members see on the horizon"
“A proper recovery would require stabilisation in the property sector, a clear end to deflationary pressures, and more supportive stimulus measures to boost confidence”
“The situation in the Red Sea continues to erode as Iran-backed Houthi rebels continue to launch attacks on commercial vessels with the goal of pressuring Israel into a cease fire. yet the reaction in oil prices has been relatively benign.”
“The short-to-medium term outlook is dependent on the path of monetary policy, inflation, the resilience of the global economy, and geopolitics.”
“CCIAM continue to advocate for a more defensive positioning”
Overview
A soft landing, where the inflation subsides and economies slow without the entering a recession, has become the more likely scenario for advanced economies. Expected global growth rates remain positive but have declined over the past 3 years and divergences are appearing between economies. The World Bank forecasts global growth to be 2.4% in 2024, which reflects the lagged transmission of recent rapid tightening in monetary policies, restrictive credit conditions, and weaker global trade. Most central banks are at or near the end of their rate hiking cycles and are expected to begin cutting rates in 2024.
The US economy has showed ongoing strength, with GDP growing 5.3% on an annual basis in Q3 2023, the fastest pace in almost 2 years. Consumption led growth has been supported by a resilient jobs market and households’ ability to draw down on excess savings. US headline inflation has moderated to 3.4% December 2023, which is significant progress from the 6.4% rise in prices seen a year ago. Shelter cost remain the largest driver of inflationary pressures, however Fed officials expect this to decline over the next year as current leases roll over to lower rents.
The European economy has lagged it’s developed global peers as tight monetary and fiscal policies weigh on growth. Headline inflation rose 2.9% in December, re-accelerating after 6 months of consecutive falls. The ECB has reached the end of their rate hiking cycle and will likely take a cautious approach to cutting rates. The Bank of England is also expected to begin rate cuts in 2024 after headline inflation eased to 4% in December and indicators of economic growth have slowed.
China’s economy continues to struggle with weak consumption, trade, investment, and an ongoing property market slump. So far, the government has drip fed fiscal stimulus measures with incremental increases in magnitude. Despite the large fiscal response, the economy is still lagging global peers due to the property sector turmoil, which traditionally has been a key driver of growth. This has also fed into weak consumer sentiment and has impacted related industries from construction to financial services. The monetary response has also been ineffective so far, as policy makers need to make a fine balance of providing additional liquidity without significantly devaluing the local currency.
Economic Views
Australian economic growth slowing and labour market softening
Australia’s GDP grew 0.2% in the September quarter and 2.1% on an annual basis. Growth has been positive for the last eight quarters, but the pace of growth has slowed. When adjusted for population, GDP per capita contracted 0.5% over the same period. Growth in the last quarter has been primarily driven by government expenditure and capital investment. Households contending with higher mortgage rates have led to a reduction of discretionary spending in the economy, especially on fresh food, alcohol and gambling. Households were also only able to save 1.1% of their disposable income in the last quarter, the lowest level since 2007. Softening consumer demand has fed through to lower inflation of 4.3% in November. The Australian labour market remains strong but is showing signs of softening. The unemployment rate ticked up to an 18-month high of 3.9% in December and the number of people employed declined, which can be attributable to seasonal hiring patterns during the holiday period. The recent slowdown in the growth rate of hours worked and the overall growth rate of employment points to a cooling labour market.
House prices rose 8.1% in 2023, rebounding from a 3.9% decline in 2022, according to Core Logic. The rate of house price growth slowed through the second half of the year. The impact of rate rises, higher stock levels and lower sentiment has contributed to cooling price growth, especially in the lower end of the market. Data from APRA has shown a large drop in the total share of high debt to income home loans from 17.1% in September 2022 to 5.7% in September 2023. Home values in the upper end of the market have been supported by wealthy Australians and new migrants. New housing starts hit a decade low and it is unlikely there will be more supply in the short term until higher selling prices or lower construction costs make large scale developments viable.
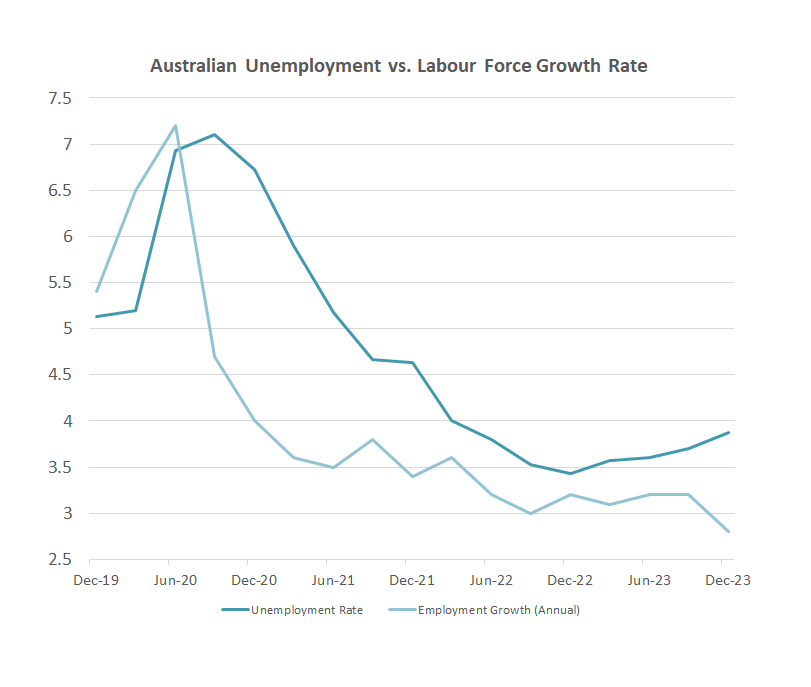
Chart 1 - Source: ABS
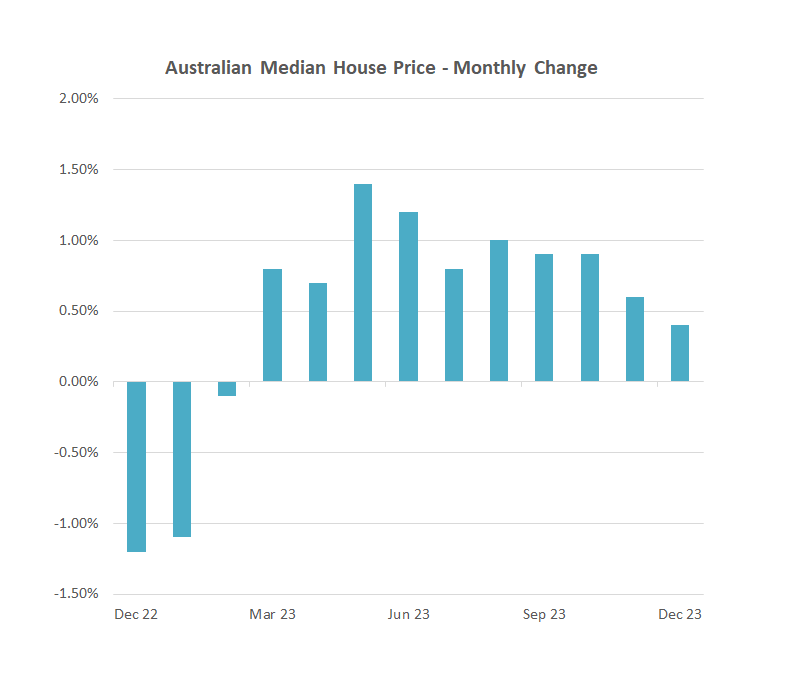
Chart 2 - Source: CoreLogic
Fed pivot as inflation cools
Over the past few months markets have quickly pivoted from expecting central banks to keep policy rates higher and longer, to expecting an aggressive rate cut cycle to being in 2024. The catalyst for the shift in sentiment was positive inflation data and a dovish December FOMC meeting, where the Fed released an updated dot plot showing policy makers expectations for 3 quarter point rate cuts in the next year. They also released a summary of economic projections that showed an improvement in the growth outlook and lower inflation expectations.
Keeping policy rates restrictive for longer than necessary brings the risk of recession and a sharp rise in unemployment, as the lagged effects from the recent tightening cycle continue to flow through the economy. On the other hand, if monetary policy is eased too soon, there is a material risk that inflation could re-ignite. But has the market gone too far? At the most optimistic point, markets had priced in up to 6 rate cuts in the next year, which is double what even the most optimistic Fed members see on the horizon. At the time of writing, markets expect rate cuts at each FOMC meeting beginning from March.
The Fed has two objectives of pursuing maximum employment and price stability. So far, the US labour market has shown remarkable resilience in the face of the most aggressive tightening cycle in decades, only recently showing some signs of softening. Given employment is holding up, the current focus continues to be inflation, which rose 3.9% on an annual basis in December as measured by core CPI. This is still above the Fed’s target of 2%. The Fed has acknowledged monetary conditions are currently sufficiently restrictive and persistently sticky inflation would likely lead to them keep rates on hold higher for longer. They have not closed the door on further hikes if deemed necessary. If markets expect this on the horizon, yields bond yields would likely adjust and financial conditions would tighten as a result.
In the current consensus view of a soft-landing scenario where labour market conditions soften further and inflation is sufficiently back to target, the Fed can cautiously begin to loosen policy towards a neutral level. However, assuming inflation falls back within acceptable levels and given that US economic growth is around trend levels and labour markets are near full employment, it could be seen that the neutral level of interest rates could be higher than the 2.5% level estimated by the Fed before the pandemic. It is hard to see a scenario where they would begin aggressively cutting rates early. Fed speakers have continued to push back against the market expectations. 6 rate cuts would require a sharp deterioration in economic activity, where the Fed would have to step in to support the economy.
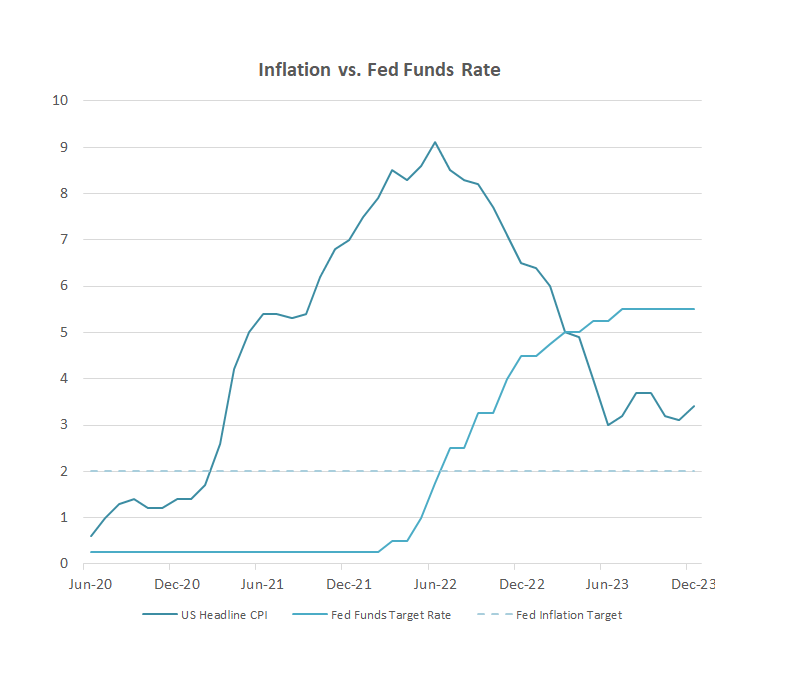
Chart 3 - Source: Bloomberg
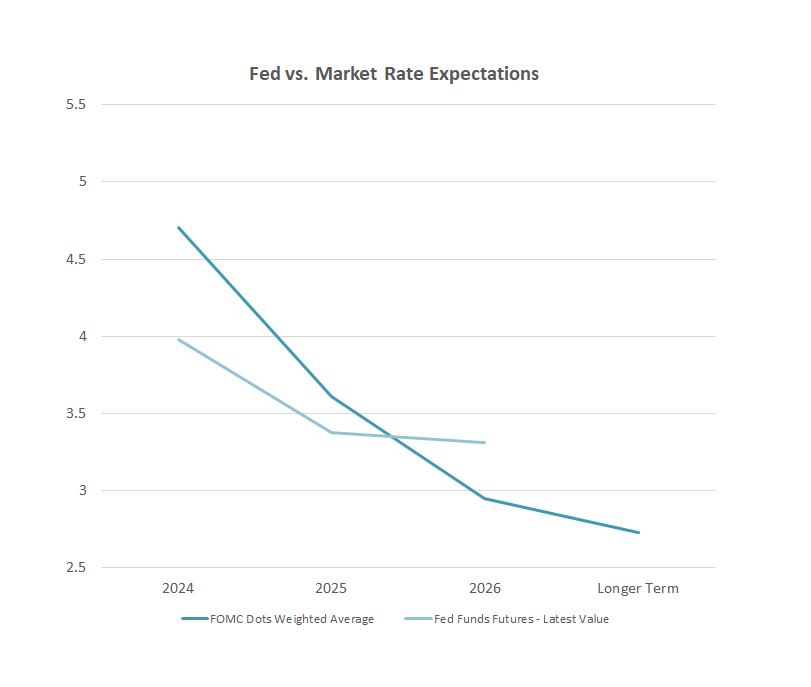
Chart 4 - Source: Bloomberg
China's economic challenges
Expectations for a strong broad based Chinese economic recovery in 2023 never materialized. While there have been some strong pockets of growth, notably among the sectors of tourism and electric cars; the country faces challenges from a struggling property sector, weaker global demand, and rising unemployment. A proper recovery would require stabilisation in the property sector, a clear end to deflationary pressures, and more supporting stimulus measures to boost confidence.
The country’s largest real estate developers continue to tackle serious debt issues as part of the government’s plan to deleverage the real estate sector, which began in 2020. The real estate market and related industries accounted for 20% of the economy and remains the largest drag on China’s growth outlook. New home prices in 70 cities have posted six months of straight declines and further falls in house prices would feed into a worsening of household confidence. There is currently an imbalance between supply and demand. Adding to oversupply concerns are the completing of previously unfinished property developments and multiple homeowners seeking to sell properties to prevent further losses.
So far, the stimulus measures that have been drip fed into the economy have not had a significant impact. This has included the largest issuance of government debt in years, short term loans for commercial lenders and a reduction in down payment ratios for first and second homes in Beijing and Shanghai. Authorities appear to have shifted gears from preventing risks to pursuing progress while maintaining stability.
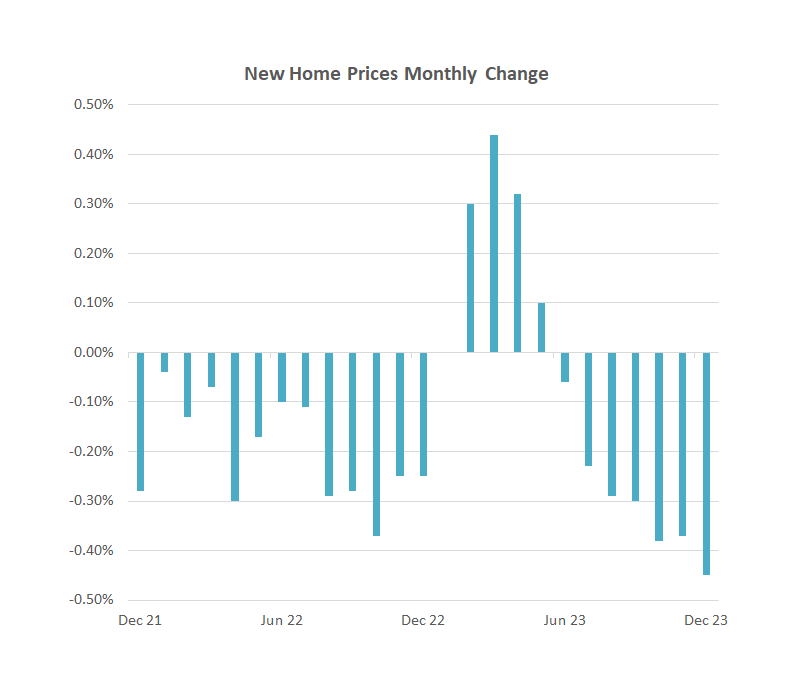
Chart 5 - Source: Bloomberg
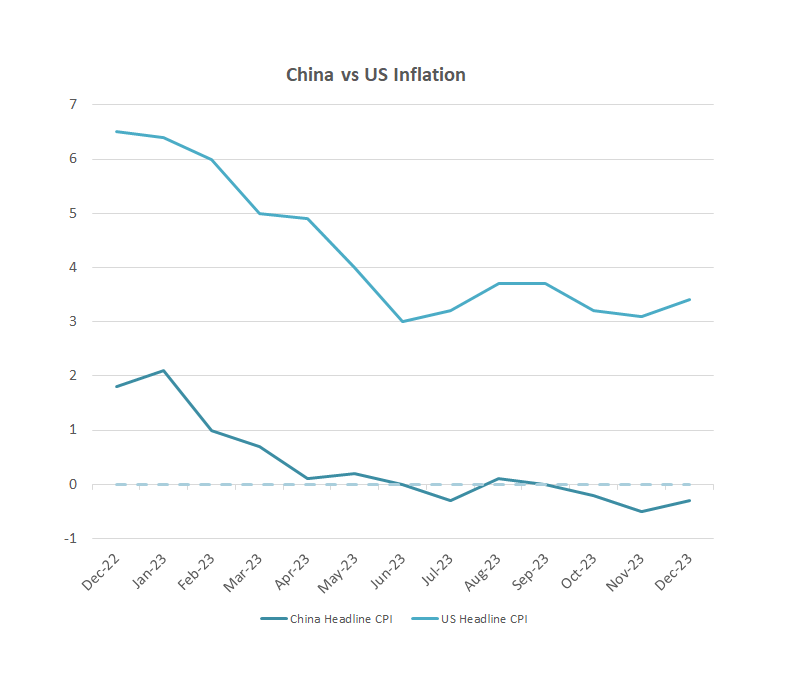
Chart 6 - Source: Bloomberg
Rising geopolitical tensions
The last few decades of progress with globalisation appears to be reversing, with an increase in regional conflicts and more countries looking to move manufacturing back on shore. The Russia-Ukraine war highlighted the fragility of global supply chains leading to worsening inflationary pressures. Tensions in the Middle East and Asia have so far been relatively contained; however, escalations could impact the flow of global trade.
The ongoing Gaza-Israel war captured news headlines last year and appears to have no clear solution. Israel is facing international scrutiny to end its offensive in Gaza amid mounting civilian deaths. Tensions on Israel’s surrounding borders of Lebanon and the West bank continue to escalate. Arab states have been working on a plan to end the war, create a Palestinian state, and prevent a wider Middle Eastern conflict. However, Israel’s Prime Minister Benjamin Netanyahu, has rejected calls by the US to scale back its military offensive, instead staying defiant on Israel’s goal of destroying Hamas and the safe return of all hostages.
The situation in the Red Sea continues to erode as Iran-backed Houthi rebels continue to launch attacks on commercial vessels with the goal of pressuring Israel into a cease fire. Yet the reaction in oil prices has been relatively benign compared to what was seen at the onset of the Russia-Ukraine war. This can be attributed to traders concerns of declining global demand outweighing the risks of supply disruptions and lack of evidence so far that global supply has been disrupted. There is a material risk that the conflict could spread into a regional conflict that disrupts crude oil flows out of the Strait of Hormuz, where over double the amount of oil to the Red Sea trades through.
Tensions are also simmering in Asia, where China sees the democratically governed island nation of Taiwan as its own territory. The newly elected President, William Lai Ching-Te, is seen as a troublemaker by China, and is ruling with a minority parliament. This weaker political position gives China the opening to continue to increase pressure on the nation, potentially leading to a boiling over point for US-China tensions. A weak Chinese economy would hold back China from taking more aggressive military measures as they cannot risk sanctions that would further add to their economic woes. Taiwan produces 60% of the world’s semiconductors and makes some of the most advanced chips used in everything from phones to Artificial Intelligence, with TSMC being the largest manufacturer globally. A military invasion of Taiwan would see chip manufacturing grind to a halt and unleash a massive inflationary wave on crucial electronics.
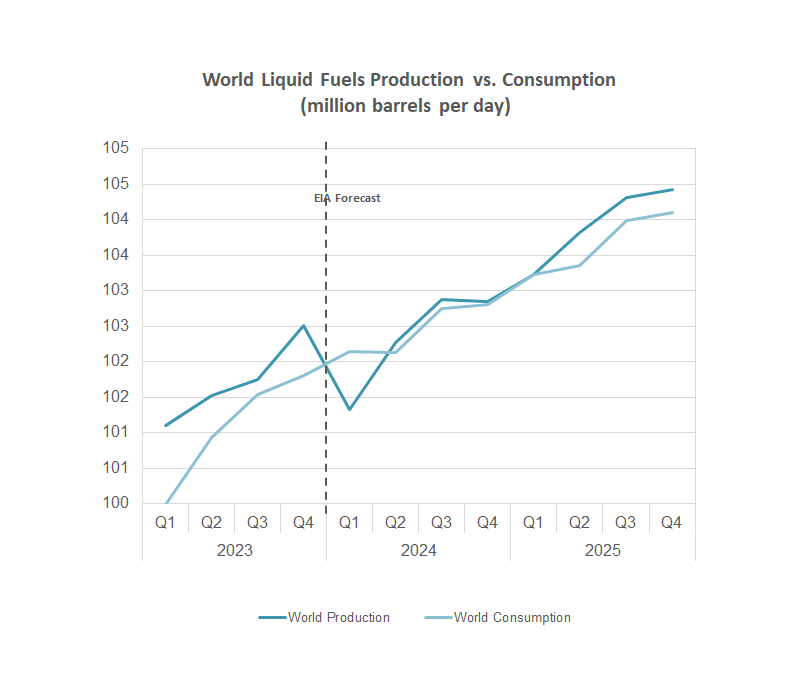
Chart 7 - Source: Energy Information Administration (EIA)
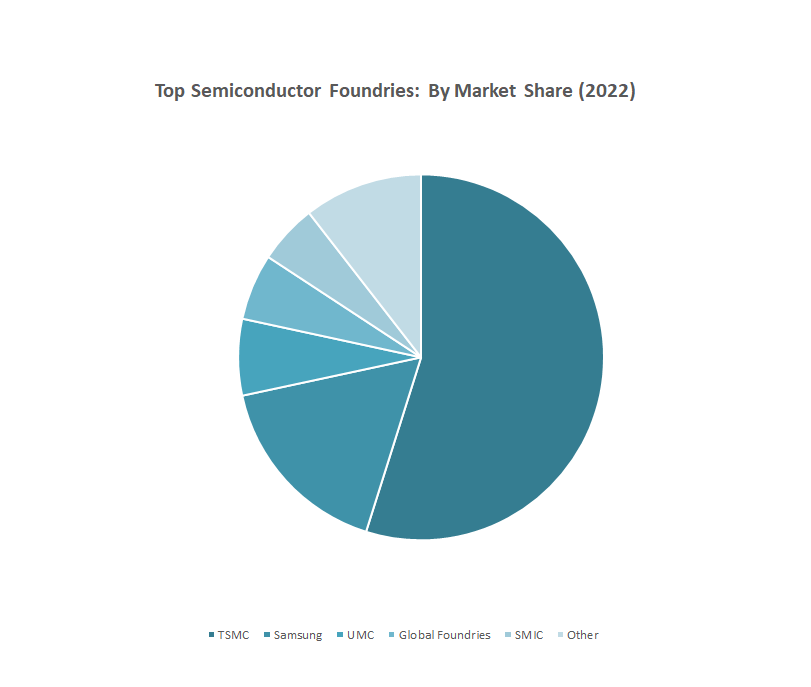
Chart 8 - Source: Bloomberg
Macro Views
Our global macroeconomic economic views are set out in the following table:

Australia | Inflation is moderating however there is a risk that strong labour markets, services demand, higher real incomes, and high rents could keep inflation sticky in the short term. House prices continue to rise despite higher mortgage rates. Consumption growth has slowed further from higher cost of living pressures. The labour market remains strong, supported by immigration. High household debt, upside risk to inflation and China’s stalled economic recovery remain as key risks for the economy. | |
USA | The US economy has showed ongoing resilience in the face of higher interest rates. Growth has been lifted by strong consumption, supported by a strong labour market and households being able to draw on excess savings. The lagged effects of higher rates are still flowing through the economy as households has been largely insulated from higher rates due to the fixed long-term structure of home loans. Credit conditions have remained restrictive and credit growth is slowing, which is expected to constrain future demand and contribute to consumer and business confidence levels remain low. | |
Europe & UK | European nations have seen weak growth the ECB’s rapid tightening cycle have impacted consumer demand and industrial output. Growth is particularly weak Germany, which is edging on a recession, and economic activity in France and Italy have stalled. Labour markets have held up with low unemployment levels and positive real wage growth, which should support consumer demand and confidence. A lack of policy space and the ongoing conflict in Ukraine remain headwinds to growth in the region. | |
China | The Chinese economy continues to face headwinds from weak consumption, trade, and investment. The ailing residential property sector, which historically has been a driver of growth, is also weighing on economic recovery. So far government stimulus measures have had minimal impact as they are modest compared to past easing cycles. |
Upside and Downside Case
The table below shows the opportunities and risks around our base case. The following shows the opportunities and risks around our base case. The short-to-medium term outlook is dependent on the path of monetary policy, inflation, the resilience of the global economy, and geopolitics.
Upside
- Soft landing scenario, where central banks can get comfortable with inflation being controlled and start to reduce policy rates
- Significant economic stimulus from China supporting global economic growth
Downside
- Economic growth deteriorates meaningfully, and central banks are forced to cut rates even if inflation remains elevated
- Central banks do not cut rates even as economic growth contracts
- Escalations in the severity of ongoing wars or outbreak of new geopolitical conflicts
Total Portfolio Positioning and Key Implication for Market

Financial markets remain volatile with an abating risk of economic downturn. Central banks may retain restrictive monetary policy even as inflation is moderating or rapidly loosen policy in response to an economic downturn. In either scenario equities would be seen to underperform. Against this backdrop, CCIAM continue to advocate for a more defensive positioning.
We have retained our underweight positions in Equities and Property and overweight position in Fixed Income for downside protection.
Key: Our asset class views are considered when positioning the portfolio against its Strategic Asset Allocation (SAA).
Positive views would likely lead to an overweight position against the SAA.
Negative views would likely lead to an underweight position against the SAA.
Asset Class | Key views | Rationale |
Australian equities | Domestic valuations are at more reasonable levels relative to global peers. More significant stimulus measures from China would drive valuations for the Resources sector and commodity prices higher. Bank valuations are at reasonable levels relative to historical, however headwinds from slowing loans growth and potentially higher delinquencies from higher interest rates are the key risk for the sector. Valuations outside of the resources and financial sectors are elevated. | |
Global equities | The resilience in US economic activity has been the key driver of global equities over recent quarters. This has supported corporate earnings and market expectations for earnings remain optimistic. US valuations are elevated and driven largely by the Technology sector, which has been consistently delivering earnings growth. Developments in Artificial Intelligence could provide a further boost to earnings. US equities are trading at a premium to other counties. Equities markets in the UK, Europe and Japan are trading at a discount. | |
Fixed interest - Gov’t Bonds |
| Government bond yields are attractive on a risk adjusted basis. The yield curve in Australia is now slightly positive and the term premium is approaching the long-term median. Most central banks are reaching the end of their tightening cycles, however sticky inflation may put upward pressure on yields. |
Fixed interest - Credit |
| Credit spreads have narrowed broadly since March 2023 but remain above its historical median. Australian spreads have narrowed less relative to US, which retains the relative appeal of the domestic market. Australian credit is dominated by the financial sector where the key risk is the health of borrowers and the housing market. |
Property |
| Property continues to see downward revaluations due both cyclical and structural headwinds, and yields are at very low premiums to bonds. From a sector perspective, retail property has been supported by resilient consumer spending and a rising population. The office sector continues to face headwinds from weak rental growth and demand for office space as business confidence falls and global growth slows. |
Cash |
| Cash provides capital protection and reduce portfolio volatility. Yields have increased in line with rate hikes which improved returns. |
Foreign Currency | The AUD has appreciated from a narrowing of relative policy rates to the US and rising commodity prices. There is support for the AUD at current levels in the longer term. The short-term outlook for the AUD will be impacted by how global interest rate differentials evolve and the level of stimulus to the Chinese economy. |
Source: Frontier
Disclaimer
CCI Asset Management does not guarantee the repayment of capital or the performance of any product or any particular rate of return referred to in this presentation. The information contained in this presentation is current as at the date of preparation but may be subject to change.
While every care has been taken in the preparation of this document, CCI Asset Management makes no representation or warranty as to the accuracy or completeness of any statement in it including, without limitation, any forecasts.
The information contained in this presentation is intended as general commentary, view and perspective by CCIAM, and CCIAM’s Asset Consultant, Frontier Advisors Pty Ltd, and should not be regarded as financial, legal or other advice.
This presentation has been prepared for the purpose of providing general information, without taking account of any particular investor’s objectives, financial situation or needs. An investor should, before making any investment decisions, consider the appropriateness of the information in this document, and seek professional advice, having regard to the investor’s objectives, financial situation and needs.
Should you require specific advice on the topics or areas discussed please contact the presenter directly or an appropriate advisor. This presentation may contain forward-looking statements. Past performance is not a reliable indicator of future performance.
The contents of this presentation are confidential and must not be disclosed to any third party without the consent of CCIAM. This presentation must not be copied, reproduced or distributed without the consent of CCIAM.